
Testing, Formatting & Debugging
The teaching becomes unusually direct here, because Odin's test runner is written in Odin, is documented in the same voice as the language, and is part of the standard library. Most of this lesson is quoted from that documentation — which is also the best argument for the design: nothing about testing in Odin needs a framework of its own.
A Test Is a Procedure
Odin's testing documentation makes a claim that defines the whole approach. Quoted verbatim:
In Odin, we run tests by using the `odin test` command to compile and run our
test suites. An Odin test suite is no different from a regular Odin program,
and a test itself is no different from an Odin procedure.
That is not a slogan; it is the mechanism. There is no test class to inherit from, no assertion macro that rewrites your source, and no separate test language. There is an attribute, and there is a package.
The @(test) Attribute
Quoted from the same page, this is a complete test file:
package tests

import "core:testing"

@(test)
my_test :: proc(t: ^testing.T) {
    // This tests succeeds by default.
}
And the rules that go with it, quoted verbatim:
All individual tests require the `@(test)` attribute. This is how the compiler
knows which ones to send to the test runner. They also must accept one and only
one argument: `^testing.T`. It can be named anything you want it to be, but by
convention, virtually every test uses `t`.

`^testing.T` is a pointer to a special `struct` defined by the `core:testing`
package.
A test is an ordinary procedure, so it lives in your package and can call your package's unexported procedures — no test-only visibility tricks, because private in Odin is private to the package, and the test is in the package. The single argument is the test's own state: a pointer, because the runner updates it as expectations are checked. And since the compiler identifies tests by attribute rather than by file name or naming convention, you can put them beside the code they test, in the same package, without any build configuration at all.
Expectations
An empty test proves nothing. The checking procedure is testing.expect, and the documentation describes it as "the heart of how tests are measured". Quoted verbatim:
@(test)
my_test :: proc(t: ^testing.T) {
    n := 2 + 2

    // Check if `n` is the expected value of `4`.
    // If not, fail the test with the provided message.
    testing.expect(t, n == 4, "2 + 2 failed to equal 4.")
}
Three arguments, and the third is the one that makes failures readable later: a message you write for the person who will see the failure, which may well be you in six months. A good message states the expectation, not the symptom.
When a comparison has an expected value on one side, there is a procedure that says so and remembers both operands so the failure can report them. Quoted from the documentation's own example:
// Add up all the rune values in the string.
my_very_simple_hash_function :: proc(str: string) -> (result: int) {
    for r in str {
        result += cast(int)r
    }
    return
}

@(test)
my_test :: proc(t: ^testing.T) {
    hash := my_very_simple_hash_function("hellope")
    testing.expect_value(t, hash, 745)
}
Note the by-now-familiar machinery in the procedure under test: for r in str iterates the runes (Phase 2), the named result is assigned rather than returned explicitly (Phase 3), and cast(int)r converts each rune — the same conversion rule as always, written out in the open. The test then states the expected value, and expect_value has both numbers in hand if the expectation fails.
The documentation adds a note worth keeping in mind while writing tests:
**Note:** A test can have multiple `expect`ations, not just one. You can use any
combination of the procedures documented here.
Running the Tests
You already met the command in the setup lesson: odin test .. What the runner does with your package is worth seeing in full, because several of its features are things you would otherwise build yourself.
Quoted verbatim from the documentation's feature list:
- Multi-threaded by default.
- Memory usage tracking: tests will report leaks and bad frees when complete.
- Logging: each test is given a thread-safe logging interface.
- Cancel early with `CTRL-C`.
- Gracefully handles segmentation violations, asserts, and panics from within tests.
- End-of-run summary with a listing of failed tests.
- ANSI-colored animated progress report.
- Test-wide per-run random seed.
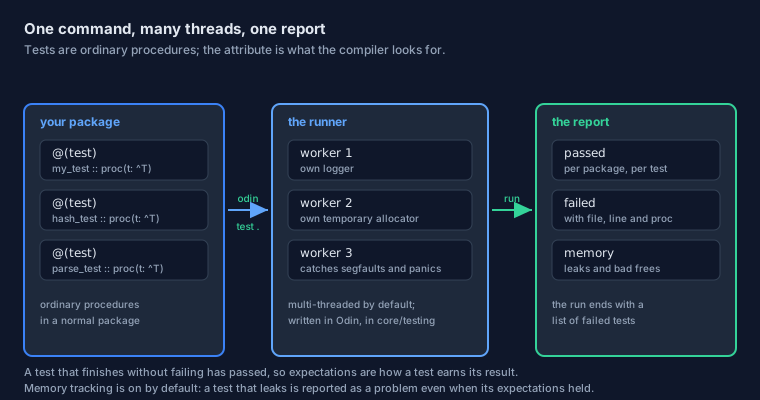
odin test
Run it on the directory you are working in — odin test . — and the runner compiles the package, finds every procedure carrying the attribute, and runs them. Two of those features deserve a second look.
"Multi-threaded by default" connects straight to the previous lesson. Each test runs on a worker thread with its own context, which is precisely the context-per-thread rule you just learned. It also means tests must not depend on each other: any shared state they touch is shared across threads that run in an order you did not choose.
"Memory usage tracking" is the feature that makes Odin's runner more than a convenience. Because every allocation in Odin names an allocator, the runtime can see what a test allocated and what it freed — so a test that forgets to release something fails, even though its expectations were satisfied. The documentation is explicit that this is on by default and that you can turn it off with a compile-time option: ODIN_TEST_TRACK_MEMORY=false.
And "gracefully handles segmentation violations, asserts, and panics" means one broken test does not take the run with it: the failure is caught and attributed, and the remaining tests still execute. That is the same robustness from the errors lesson, applied to the test runner itself.
Several Packages at Once
By default the runner tests the package you named and not the packages it imports. To run everything in a tree of subdirectories, the documentation gives the command and the idiom:
// Quoted from the testing documentation: a top-level file that pulls in
// the packages whose tests you want run.
package tests

@require import "foo"
@require import "bar"
@require import "gadgets"
@require import "widgets"
odin test tests/ -all-packages
The @require and -all-packages pair is a small example of a larger idea: the compiler can be told to keep things it would otherwise discard. A normal import that is never used is an error in Odin, so the language provides an attribute for the case where the import is the point.
Tuning the Runner
Everything about the runner's behaviour is adjustable, and the documentation explains why the switches are compile-time constants rather than command-line flags:
The test runner is written in Odin itself, so these are `#config` options, as
opposed to regular flags.
They are passed with -define:, exactly as in the compile-time lesson. Here are the ones you will reach for first, quoted from the documentation's list:
| Option | What it does |
|---|---|
ODIN_TEST_THREADS=<n> | How many threads to use; 0 means one per core |
ODIN_TEST_NAMES=<...> | Run only the tests you name |
ODIN_TEST_TRACK_MEMORY=false | Turn memory tracking off |
ODIN_TEST_RANDOM_SEED=<n> | Fix the per-run seed, to reproduce a failure that only happens on some runs |
ODIN_TEST_FANCY=false | Plain output instead of the animated progress report |
ODIN_TEST_SHORT_LOGS=true | Shorter log lines: no date, time, or emitting procedure |
The invocation, quoted from the documentation:
odin test . -define:ODIN_TEST_SHORT_LOGS=true
That random seed is worth noticing. Because the runner hands every test a seed for the run, a test that involves randomly generated data is reproducible — when it fails, the failure comes with the seed that caused it, and you can ask for that seed again.
When Something Fails
A test suite is a conversation with your future self, and the failure message is the part of the conversation that matters most. Odin's messages are designed to be read in a terminal without further investigation.
Reading a Failure
Quoted verbatim from the documentation, this is what a failed expectation prints — the example is the hash test from earlier, deliberately broken:
[ERROR] --- [2024-06-10 17:45:38] [tests.odin:16:my_test()] expected 745, got 752
Four pieces of information, and it is worth naming them, because each one answers a different question. [ERROR] is the severity, so it sorts among other messages. The timestamp tells you the run it belongs to. [tests.odin:16:my_test()] gives file, line, and procedure — the line being the one that holds the expectation, which is where you look first. And expected 745, got 752 is the comparison itself, both numbers, because expect_value kept them.
The documentation recommends noticing the last part when writing tests, and it is the same advice as anywhere else in this tutorial: state the expectation in the message, because that is the sentence that has to make sense later:
Check if `n` is the expected value of `4`.
If not, fail the test with the provided message.
Leaks Are Failures Too
Memory tracking deserves its own paragraph, because it changes what "the test passed" means. When it is on, the runner reports leaks and bad frees; the documentation lists it as a feature of the runner rather than of the tests, which is the important part — you do not have to opt in per test to get it.
This is also why the runner gives each test thread its own temporary allocator. A temporary allocator is reset wholesale, so allocations made through it disappear at the end of the test's life — while an allocation made through the general allocator and never freed remains visible to the tracker, exactly as it should.
To see every test's memory figures, rather than only the problems, the documentation offers ODIN_TEST_ALWAYS_REPORT_MEMORY=true: "By default, only issues with memory usage are reported, such as leaks or bad frees."
Two habits follow from this, and both come from Phase 4. When a procedure in your package takes an allocator, a test can hand it an allocator it controls and then check the accounting; and when a test creates something with defer, the deferral runs at the end of the test, before the tracker looks at the books.
The Other Tools
Two smaller tools complete the daily loop, and both exist to remove a category of argument rather than a category of bug.
Formatting Without Opinions
You met odinfmt in the setup lesson: one community style, applied for you, configured by the three settings in odinfmt.json — line width, tabs, and tab width. Quoted from that lesson's habit list, the command is as short as it should be:
odinfmt -w main.odin
Two consequences are worth spelling out for anyone arriving from a language with a formatter they configure extensively. First, style never appears in a code review, because no reviewer can disagree with a tool's output — the discussion moves to the code. Second, the standard library itself is written in that style, so reading Odin's source teaches the same conventions your editor produces, and the examples in this roadmap look like everything else you will read.
One thing odinfmt will not do is change meaning. Its job is presentation: where a line breaks, how indentation is written, how declarations line up. If a line needs rewriting to be clearer, that is your job, and no formatter will do it for you.
Checking Harder With the Vet Flags
odin check . type-checks a directory without producing an executable, which makes it the cheapest feedback in the toolchain. But the language deliberately permits some things a stricter reading would reject, and for those there is a family of extra diagnostics — flags whose names begin with -vet.
| Flag | What extra complaint it enables |
|---|---|
-vet | The whole set of extra warnings, not just the default ones |
-vet-unused | Unused variables and imports, which Odin normally reports only when required |
-vet-shadowing | A name that hides an outer declaration with the same name |
-vet-using-stmt | A complaint about every using statement, for codebases that forbid them |
Turn -vet on continuously while learning, and consider making -vet-shadowing part of your normal build. Shadowing is the mistake this tutorial warned about when it introduced nested scopes and using: the code compiles, the meaning is not what the reader assumes, and nothing else will tell you.
The flag list is a moving target — new vet checks are added as the compiler grows — so treat odin help build as the authority for the version you have installed rather than any table, including this one.
Debugging
Tests catch what you expected to go wrong. A debugger catches what you did not. Odin sits comfortably in both worlds: it compiles to native code with debug information, so your usual debugger applies, and it also gives you two things of its own — traps and a cycle counter.
Printing and Location
The oldest debugging tool still works, and Odin's printing has one feature worth using properly from the start: fmt.println writes to standard output, and fmt.eprintln writes to standard error, so debug output does not contaminate the output you are piping somewhere else.
A -debug build is what makes the more useful tools available. Debug builds keep assertions active and carry the information the runtime uses to describe what went wrong, and Odin exposes the distinction to your own code as a compile-time constant. Quoted from core/c/c.odin, where the C macro that disables assertions is defined in terms of Odin's own switch:
// Quoted from core/c/c.odin: the C macro NDEBUG, which disables
// assertions, is the negation of Odin's own debug constant.
NDEBUG :: !ODIN_DEBUG
That single line is a lesson in itself: a build mode is not a command-line detail that happens to exist — it is a compile-time constant, and therefore something your code can branch on with when, keeping expensive checks in debug builds and out of release builds.
Traps, Asserts and Cycle Counters
When a program is in a state that should be impossible, the fastest way to find out how it got there is to stop and look. Odin gives you a trap for exactly that, defined in the runtime in terms of the intrinsic underneath:
// Quoted in form from base/runtime/core.odin: the named entry points
// for stopping the program at a point you choose.
trap        :: intrinsics.trap
debug_trap  :: intrinsics.debug_trap
Two names, two intentions. trap stops regardless of build mode — a hard stop that cannot be optimised away. debug_trap is the debugging breakpoint: a debugger attached to the process stops here, and without one it behaves like its ordinary counterpart. Choosing between them is a matter of whether the stop is permanent or merely convenient.
Both sit next to assert, which you have been using since Phase 2. The relationship is worth stating plainly: an assertion is a conditional trap with a message attached, compiled in or out according to the build. When an assertion's condition is false, you get the file and line for free — which is why assert beats a print statement whenever the question is "should this ever happen?"
For the opposite question — "why is this slow?" — the runtime offers a cycle counter. Quoted in form from the same file, it reads the processor's own clock, the finest measurement available on a machine:
// Quoted in form from base/runtime/core.odin:
read_cycle_counter :: proc() -> i64
Read it before and after a section of code, subtract, and you have a number of cycles — no profiler, no instrumentation, no build flags. It is a crude instrument and an excellent first measurement, and it pairs naturally with the data-oriented reasoning of Phase 4: measure what you changed, one change at a time.
Where This Goes Next
Phase 6 ends here, with a program that can call into C, run on several threads, prove itself with tests, and be investigated when it misbehaves. Phase 7 is where the language stops being described and starts being used: a page of runnable demonstrations, one per phase, and a gallery of larger sample programs to read.
The Page in One Breath
- A test is an ordinary procedure marked
@(test)that takes exactly one^testing.T;expectandexpect_valueare the checks. odin test .compiles and runs your package's tests; the runner is multi-threaded, catches crashes, and tracks memory.- A leak is reported even when every expectation held, so writing tests means thinking about allocators as much as about values.
- Runner behaviour is configured with
#configoptions passed as-define:, including the thread count and the random seed. odinfmtmakes style a non-topic;-vetmakes the compiler stricter about shadowing and unused declarations.assert,trap,debug_trapandread_cycle_counterare the built-in instruments for state and for time.